
Help and Support » Features
Analysis tool: Quality sessions
This presented feature is a premium feature that is only available for Runalyze Early Premium subscribers. You can try the premium offer for free for 7 days or upgrade directly via your upgrade page.
In order to prepare optimally for the next competition, runners cannot avoid the necessary tempo training. Of course, training also includes all those countless kilometers at a comfortable pace. But to know where you stand performance-wise – if you don’t want to rely solely on Effective VO2max – you need to take a close look at your tempo training. The new analysis tool “Quality sessions” offers exactly that: a direct look at the tempo sessions.
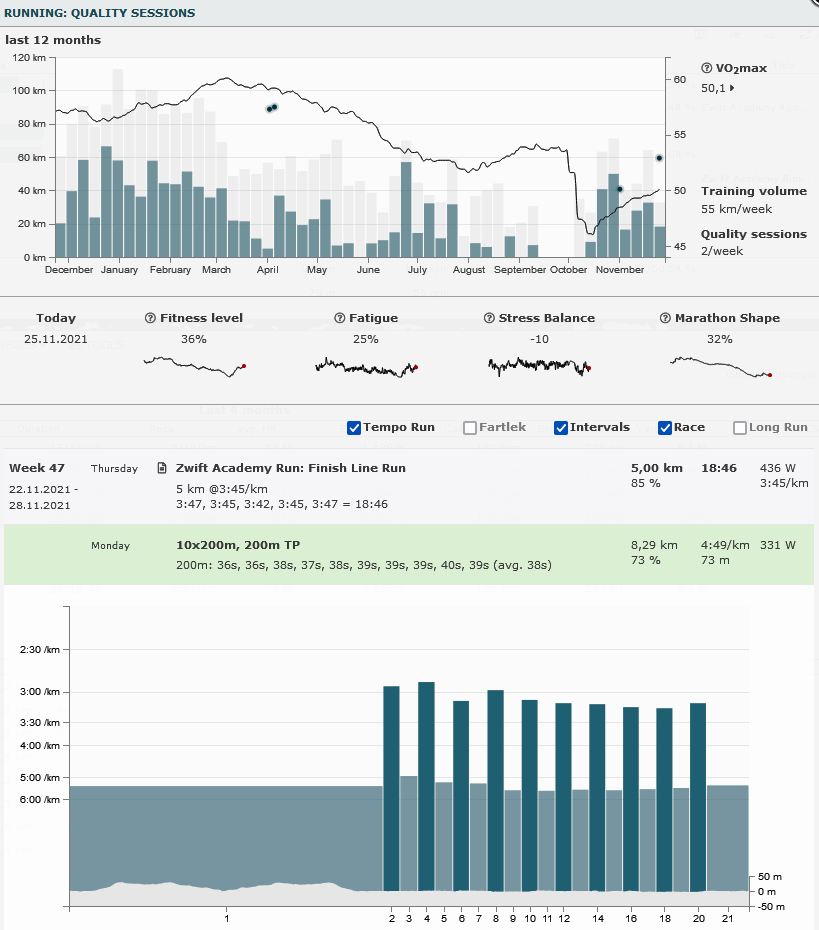
The tool is divided into two parts. In the upper section, the current form (as Effective VO2max), the current training workload and the current values (and trends) for fitness, fatigue, stress balance and marathon shape are displayed. Together with the Effective VO2max also competition results in the considered period (last 12 months) are shown. <br><br> When it comes to the training workload, the quality sessions are of course in the foreground. The blue bars therefore reflect the total distance of the quality sessions (which of course distorts the picture somewhat during long warm-ups/cool-downs), while the distance of all (running) workouts is only shown in light gray. What is a quality session can be defined in the sport settings for Running in the activity types.
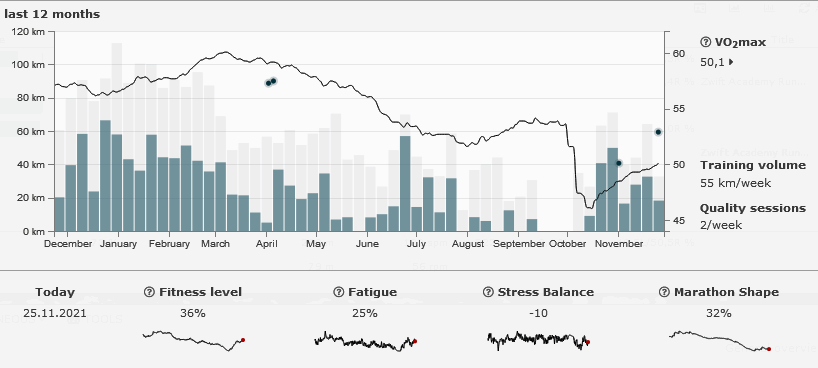 In the example shown here, a significant drop in training volume, both overall and related only to the quality sessions, can be seen starting in March. Form then dropped from a VO2max of about 60 to about 52 by August. The next abrupt drop in form occurred in early October after a three-week break from training. Clearly visible: After a three week break, three more weeks are not nearly enough to get back to the previous form.
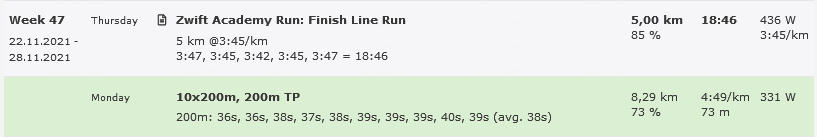 Below this is the list of all quality session (of the selected activity types) for the period under consideration. For these, in addition to distance, time, power, heart rate and altitude (the values on the right), a brief summary of the pace sections is displayed. This includes, for example, for a tempo endurance run, the average pace, total time and laps stopped, or for a simple interval workout such as 10x200m, all 200m times as well as the average time.
<br>
The automatic recognition of “related” sections, so that for example in 10x200m the 200m sections can be compared with each other, is of course dependent on the respective structure of the training session. With other interval training, especially if it is time-based rather than distance-based, this can be a bit confusing.
Below this is the list of all quality session (of the selected activity types) for the period under consideration. For these, in addition to distance, time, power, heart rate and altitude (the values on the right), a brief summary of the pace sections is displayed. This includes, for example, for a tempo endurance run, the average pace, total time and laps stopped, or for a simple interval workout such as 10x200m, all 200m times as well as the average time.
<br>
The automatic recognition of “related” sections, so that for example in 10x200m the 200m sections can be compared with each other, is of course dependent on the respective structure of the training session. With other interval training, especially if it is time-based rather than distance-based, this can be a bit confusing.
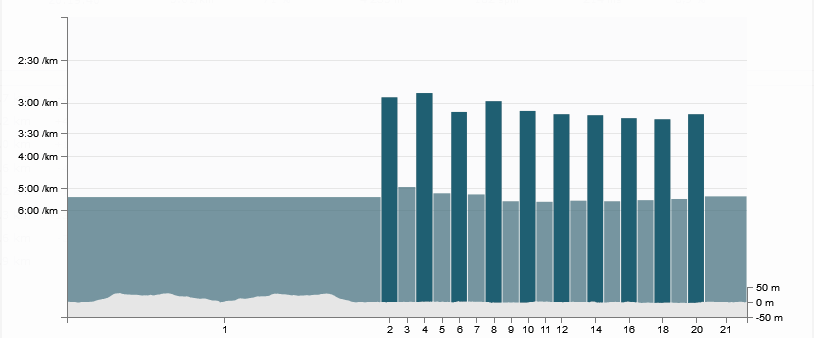 Therefore, clicking on the training line will display the diagram of the lap times (as well as the altitude profile on a small scale). The prerequisite for this is, of course, that time and distance (and altitude, if applicable) have been recorded during the activity. In addition, the “active” laps (i.e. the tempo sections) must be marked accordingly so that these can be evaluated automatically.
Related articles
Didn't find an answer to your question?
Please let us know if you have wishes or have encountered bugs. We give our best to make Runalyze as good as possible for you. - Therefore we would be interested in your suggestions for improvement. In general most questions, problems and ideas are more appropriate to ask in the forum.
 Follow us
