
Hilfe und Support » Erste Schritte
Overview
there are three sections:
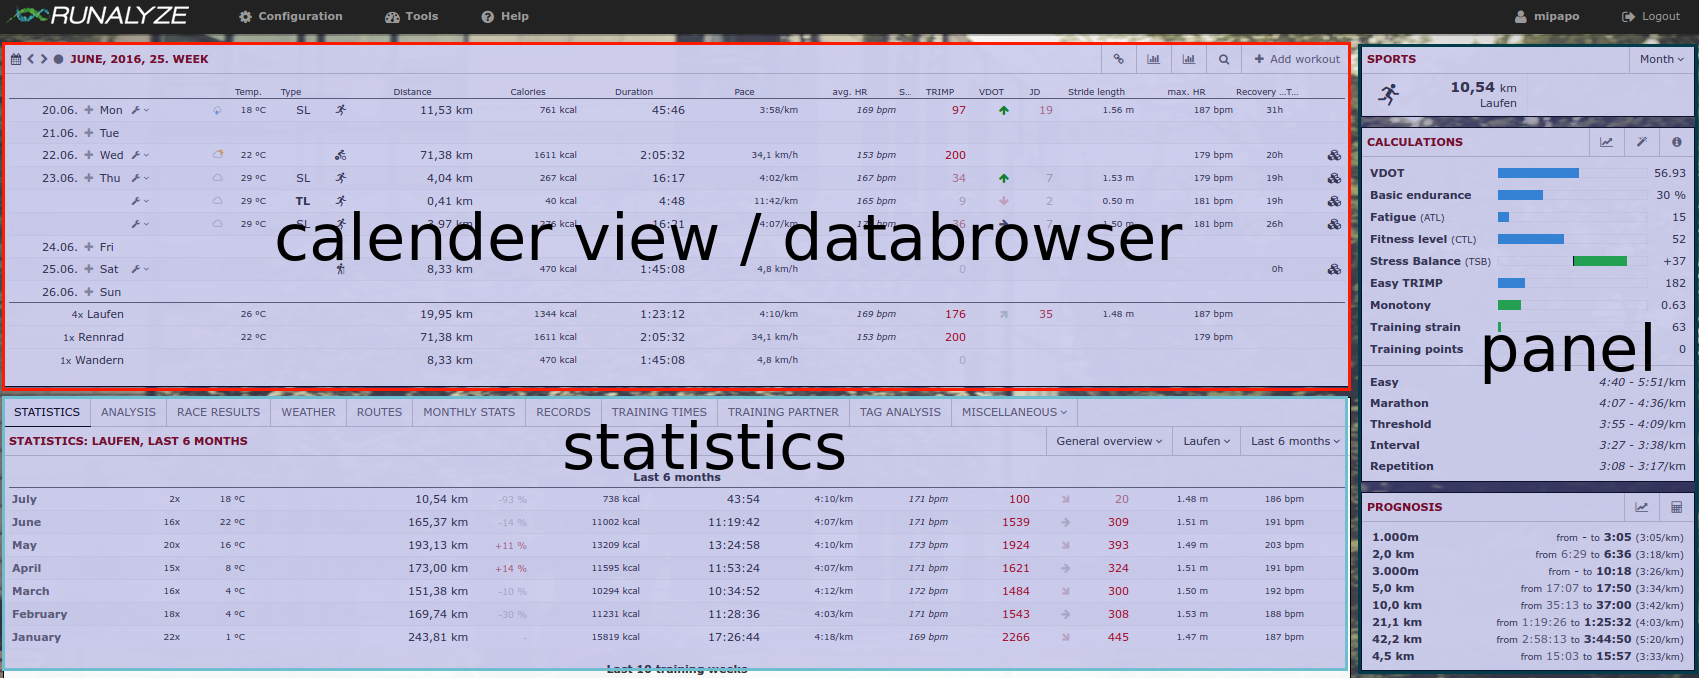
Calendar view / databrowser
Here you find a short overview of all your activities within any chosen period. You can navigate through all weeks/months/years (using the arrow icons) or select any time period (calendar icon). The set of values shown in this table is configurable. Go to “Configuration -> Dataset” and select the data you’re most interested in.
Statistics
The main focus of RUNALYZE is on statistics about your activities. We provide several “staticstic plugins” where you can find a lot of different evaluations of your activities. Be it your route map, your race results, activity records or a retrospect by the months - it’s all there (and if not, just ask us to add it).
As always: You can decide which statistics should appear and order the active ones according to your desires (“Configuration -> Plugins”).
Panels
The panels give a quick overview of the most importantdata
Ähnliche Artikel
Keine Antwort auf deine Frage gefunden?
Wir freuen uns über alle Wünsche und Fehlermeldungen von Dir. Wir wollen Runalyze für Dich so gut wie möglich machen. Dazu müssen wir aber wissen, was für Verbesserungsvorschläge und Wünsche du hast. Die meisten Fragen, Probleme und Ideen sind im Forum am Besten aufgehoben.
 Folge uns
