
Aide et support » Starting guide
Overview
There are three sections:
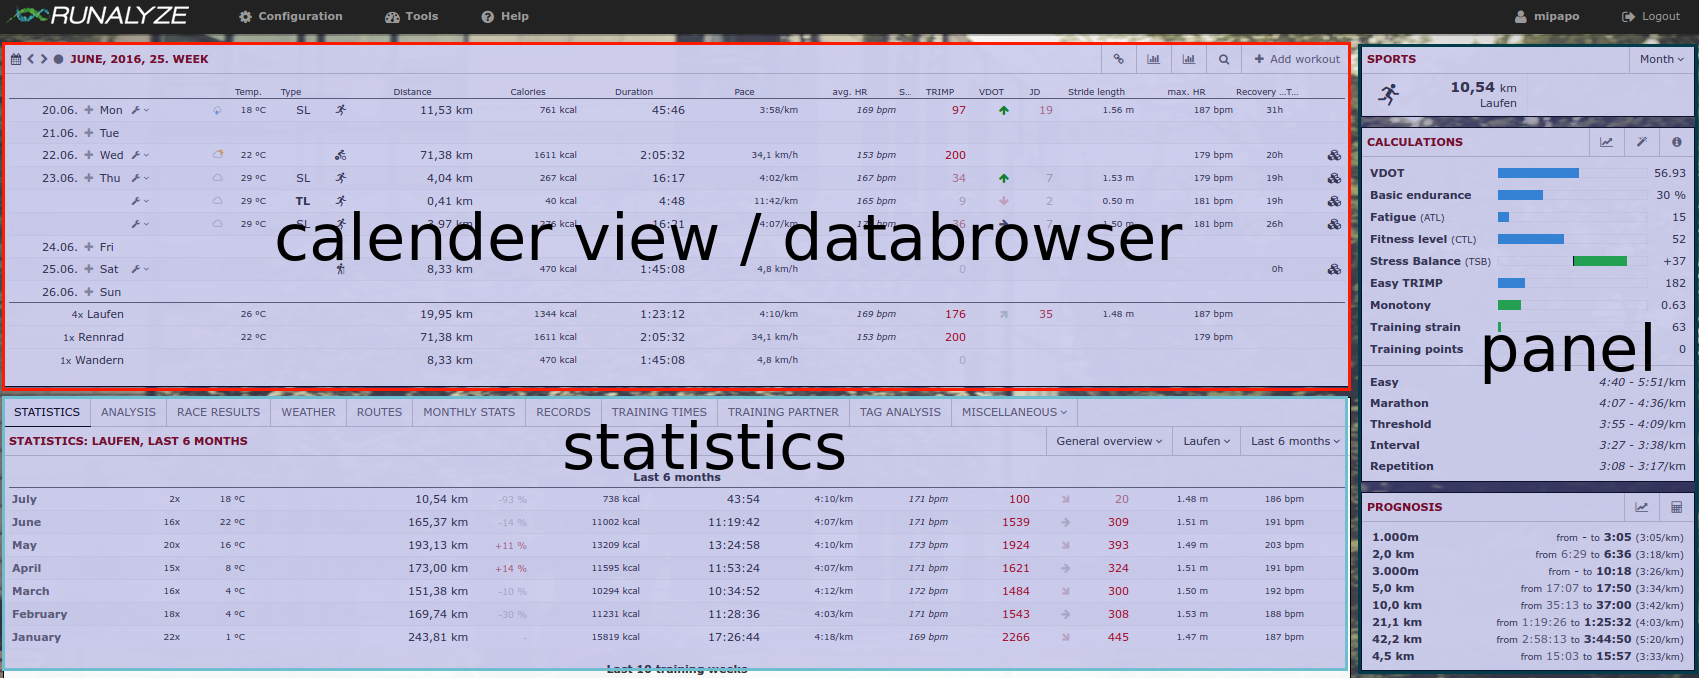
Calendar view / databrowser
Here you find a short overview of all your activities within any chosen period. You can navigate through all weeks/months/years (using the arrow icons) or select any time period (calendar icon). The set of values shown in this table is configurable. Go to “Configuration -> Dataset” and select the data you’re most interested in.
Statistics
The main focus of RUNALYZE is on statistics about your activities. We provide several “staticstic plugins” where you can find a lot of different evaluations of your activities. Be it your route map, your race results, activity records or a retrospect by the months - it’s all there (and if not, just ask us to add it).
As always: You can decide which statistics should appear and order the active ones according to your desires (“Configuration -> Plugins”).
Panels
The panels give a quick overview of the most importantdata
Articles lies
Vous n’avez pas trouvé une réponse à votre question?
Merci de nous faire part de vos souhaits ou de nous faire un retour en cas de bug. Nous faisons tout notre possible pour vous garantir la meilleure expérience avec Runalyze. Nous sommes donc toujours intéressés par vos suggestions d'amélioration. Le forum est généralement plus adapté pour discuter de vos questions, problèmes et idées.
 Suivez-nous
