
Hjelp og støtte » Starting guide
Overview
There are three sections:
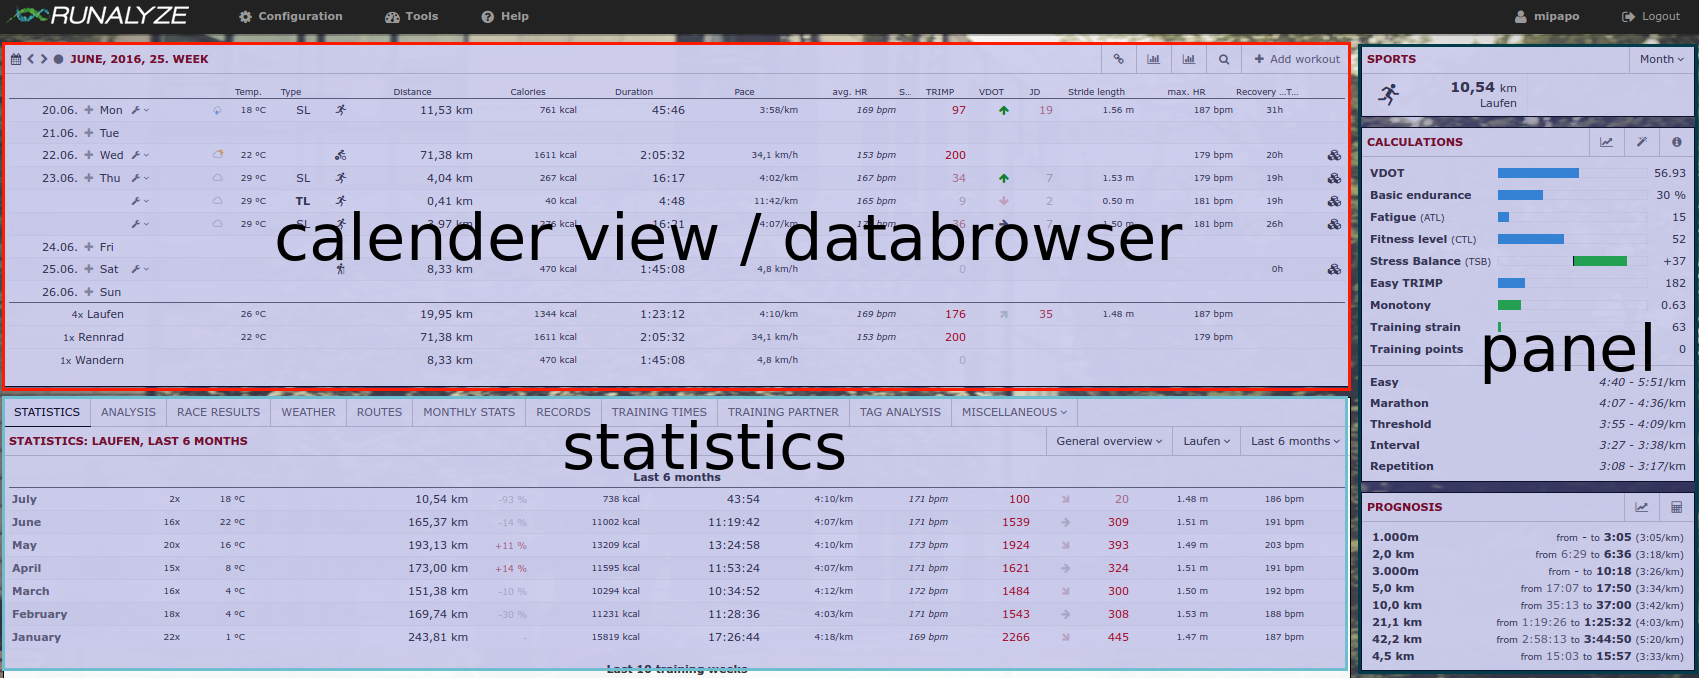
Calendar view / databrowser
Here you find a short overview of all your activities within any chosen period. You can navigate through all weeks/months/years (using the arrow icons) or select any time period (calendar icon). The set of values shown in this table is configurable. Go to “Configuration -> Dataset” and select the data you’re most interested in.
Statistics
The main focus of RUNALYZE is on statistics about your activities. We provide several “staticstic plugins” where you can find a lot of different evaluations of your activities. Be it your route map, your race results, activity records or a retrospect by the months - it’s all there (and if not, just ask us to add it).
As always: You can decide which statistics should appear and order the active ones according to your desires (“Configuration -> Plugins”).
Panels
The panels give a quick overview of the most important data. You can have a look at your shape or keep an eye on your equipment and training progress.
Relaterte artikler
Fant du ikke svar på spørsmålet ditt?
Gi oss beskjed hvis du har ønsker eller det har oppstått feil. Vi gjør vårt beste for å gjøre RUNALYZE så bra som mulig for deg. - Derfor er vi interessert i dine forslag til forbedringer. Generelt er de fleste spørsmål, problemer og ideer mer hensiktsmessige å spørre i forumet.
 Følg oss
