
Помощь и поддержка » Starting guide
Overview
there are three sections:
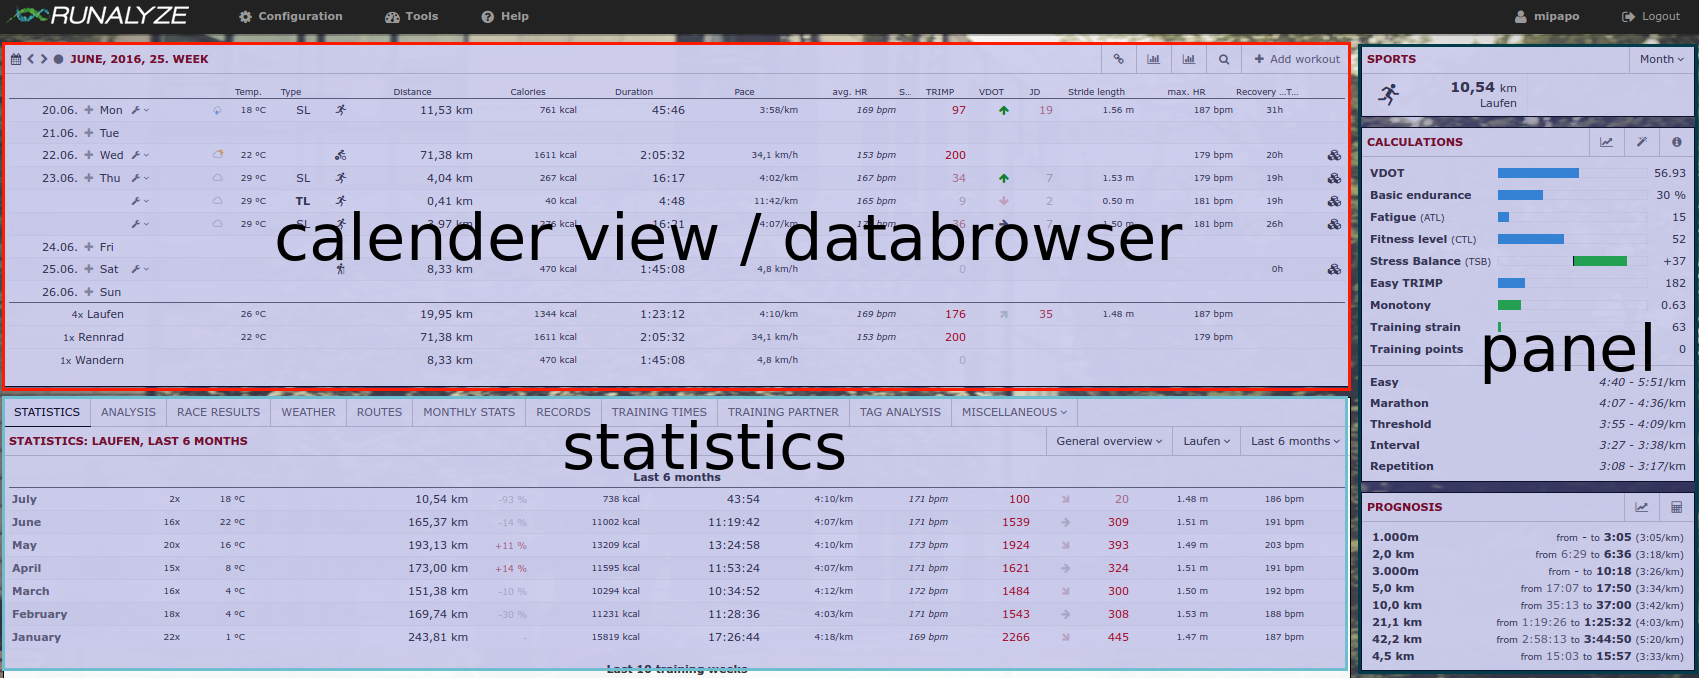
Calendar view / databrowser
Here you find a short overview of all your activities within any chosen period. You can navigate through all weeks/months/years (using the arrow icons) or select any time period (calendar icon). The set of values shown in this table is configurable. Go to “Configuration -> Dataset” and select the data you’re most interested in.
Statistics
The main focus of RUNALYZE is on statistics about your activities. We provide several “staticstic plugins” where you can find a lot of different evaluations of your activities. Be it your route map, your race results, activity records or a retrospect by the months - it’s all there (and if not, just ask us to add it).
As always: You can decide which statistics should appear and order the active ones according to your desires (“Configuration -> Plugins”).
Panels
The panels give a quick overview of the most importantdata
Связанные статьи
Не нашли ответ на свой вопрос?
Пожалуйста, сообщайте нам о своих пожеланиях или обнаруженных ошибках. Мы стараемся, чтобы Runalyze был максимально удобен для вас. - Поэтому нам будут интересны ваши предложения по улучшению. В основном большинство вопросов, проблем и идей подходят для обсуждения на форуме.
 Подпишитесь на новости
