
帮助和支持 » Starting guide
Overview
There are three sections:
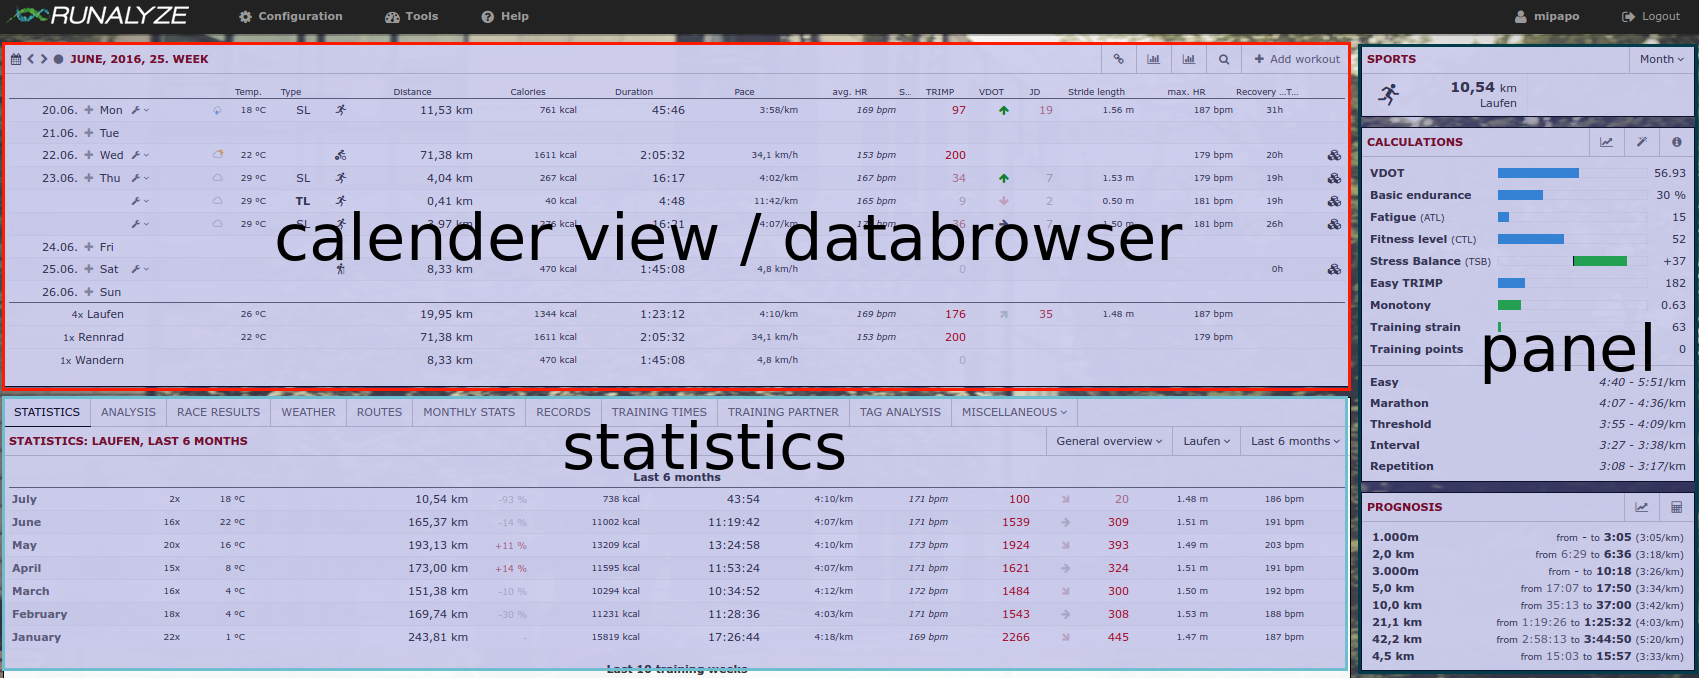
Calendar view / databrowser
Here you find a short overview of all your activities within any chosen period. You can navigate through all weeks/months/years (using the arrow icons) or select any time period (calendar icon). The set of values shown in this table is configurable. Go to “Configuration -> Dataset” and select the data you’re most interested in.
Statistics
The main focus of RUNALYZE is on statistics about your activities. We provide several “staticstic plugins” where you can find a lot of different evaluations of your activities. Be it your route map, your race results, activity records or a retrospect by the months - it’s all there (and if not, just ask us to add it).
As always: You can decide which statistics should appear and order the active ones according to your desires (“Configuration -> Plugins”).
Panels
The panels give a quick overview of the most importantdata
相关文献
找不到能回答你的问题的答案?
如果您有愿望或遇到错误,请告诉我们。 我们将尽最大努力为您提供最优质的 Runalyze。 一般来说,大多数问题、难题和想法更适合在论坛上提出。
 关注我们
关注我们
