
Suport i ajuda » Starting guide
Overview
There are three sections:
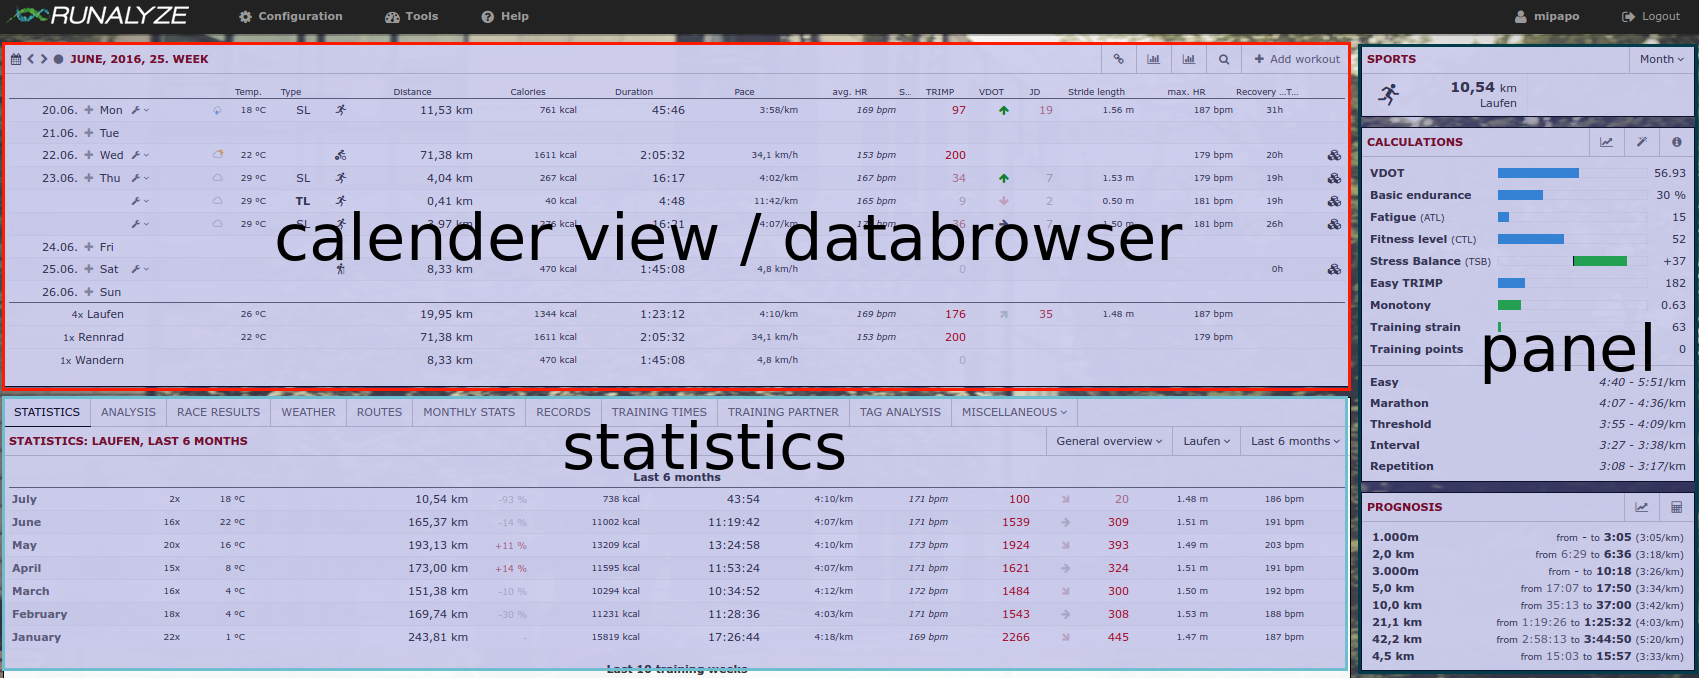
Calendar view / databrowser
Here you find a short overview of all your activities within any chosen period. You can navigate through all weeks/months/years (using the arrow icons) or select any time period (calendar icon). The set of values shown in this table is configurable. Go to “Configuration -> Dataset” and select the data you’re most interested in.
Statistics
The main focus of RUNALYZE is on statistics about your activities. We provide several “staticstic plugins” where you can find a lot of different evaluations of your activities. Be it your route map, your race results, activity records or a retrospect by the months - it’s all there (and if not, just ask us to add it).
As always: You can decide which statistics should appear and order the active ones according to your desires (“Configuration -> Plugins”).
Panels
The panels give a quick overview of the most important data. You can have a look at your shape or keep an eye on your equipment and training progress.
Articles relacionats
No heu trobat una resposta a la vostra pregunta?
Envieu-nos tots els vostres suggeriments i errades de funcionament que trobeu. Volem fer Runalyze tan bo com sigui possible per a vos. Per això ens cal saber quines són les seves propostes de millora o desitjos. La majoria de qüestions, problemes i idees s'haurien d'adreçar preferentment al fòrum.
 Seguiu-nos
