
Súgó és támogatás » Features
Tool: Anova
****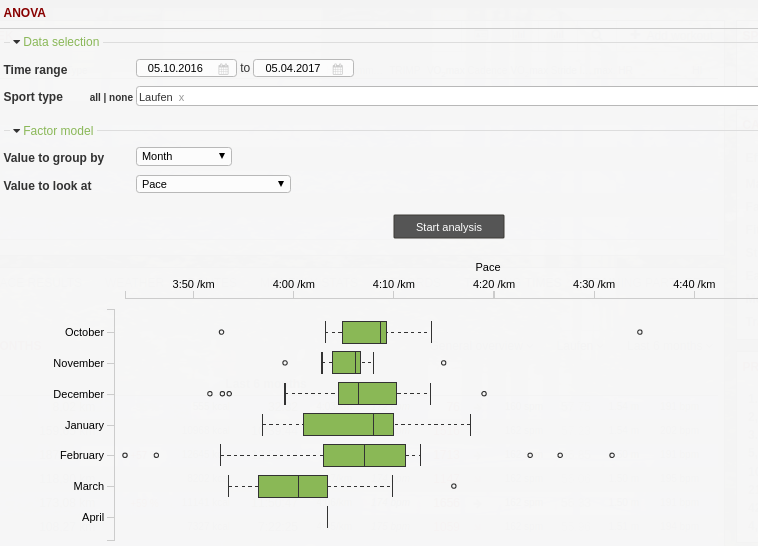
Values are visualized with so-called ‘box plots’. They give an impression of how values of a group are distributed. The middle 50% of all values are within the box itself and the so-called whiskers have a length of at most 1.5-times the interquartile range (i.e. the box’s width). Data points outside this range are called outliers.
This way of presentation allows to compare not only average values (e.g. pace over months) but deviations and outliers between different groupings. For a detailed explanation of box plots. Read more about "Box Plots" on Wikipedia.
Kapcsolódó cikkek
Nem találtál választ a kérdésedre?
Tudasd velünk, ha kívánságod van vagy hibát találtál. Próbáljuk a legjobbra fejleszteni a Runalyze-t, ezért számítunk az ötleteidre a fejlesztéshez. A legtöbb kérdésre és problémára megtalálod a választ a fórumban.
 Kövess minket
