Help and Support » Features
Tool: Streak analysis
Streak running is running at least one mile a day and can be a wonderful motivator for some runners. Some runners keep it up not only for weeks, but even months or years. Have you ever tried streak running and do you know how long your longest streak was? Runalyze can tell you now!

Until now, Runalyze could only display the current streak in the statistics module (depending on the setting, only from X days). The new tool “Streaks view” offers much more in comparison.
 The new tool “Streaks view” can be accessed in the list of tools or directly via the navigation in the header.
For a specific sport selection, all previous streaks are determined based on your training data and displayed as a table with time period, number of days, number of activities as well as total distance and duration.
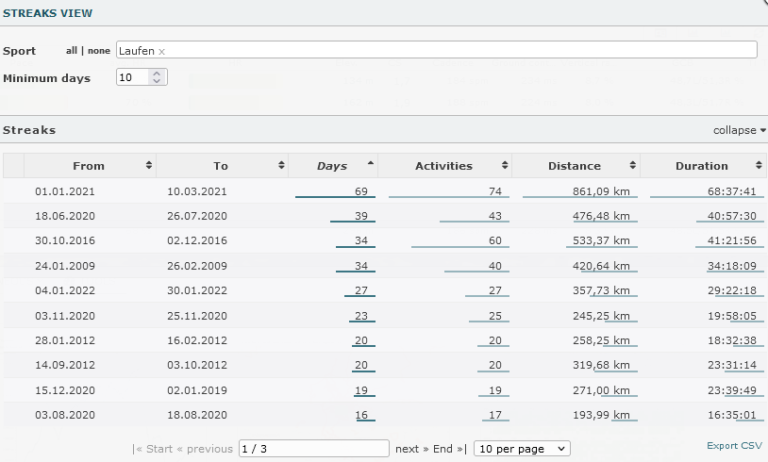
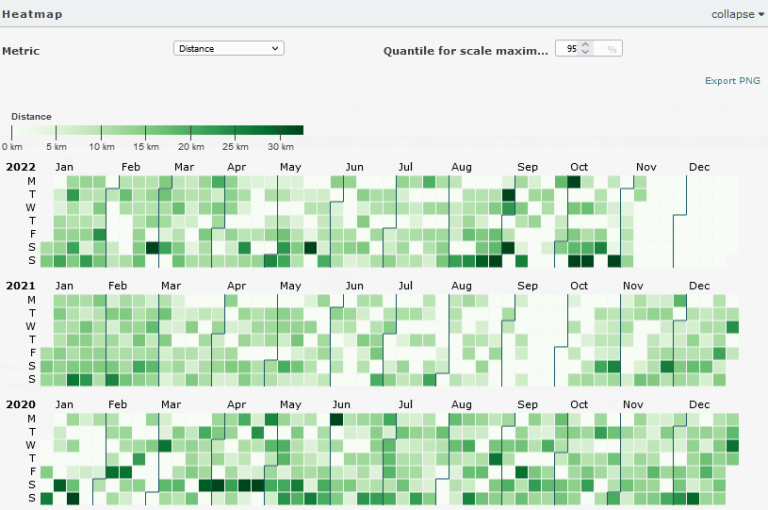
Below this is a so-called calendar heatmap, on which all activities (of the selected sport(s)) are displayed in color depending on the selected metric. In the default case, a green box simply appears for a day if there is at least one activity for that day. This makes it easy to identify the streaks as contiguous blocks. Furthermore, if a row is clicked in the table, this streak is highlighted in the heatmap.
If you choose something else as a metric, the days will be colored according to the activity values. For example, if you choose “Distance”, you can see on which days you have been running especially far. The scale is automatically based on your data. Only the lowest 95% (depending on the setting for “Quantile for scale maximum”) are taken into account so that individual outliers do not totally distort the scale.
Related articles
Didn't find an answer to your question?
Please let us know if you have wishes or have encountered bugs. We give our best to make Runalyze as good as possible for you. - Therefore we would be interested in your suggestions for improvement. In general most questions, problems and ideas are more appropriate to ask in the forum.
