Help and Support » Features
Tool: Poster Generator
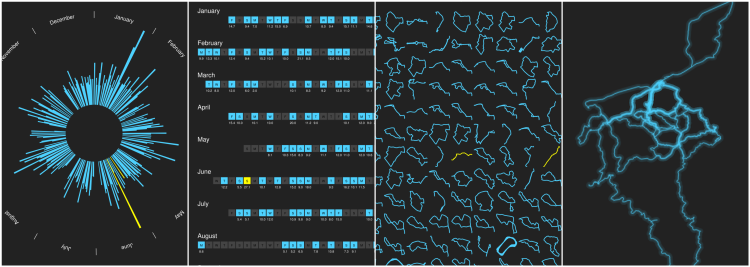 Based on your data RUNALYZE can generate some posters for you. You can choose between four poster types:
- Heatmap: A heatmap which shows all your running tracks of the past year
- Grid: A grid which shows each running track of the past year separated
- A calendar view which shows all days you ran
- Circular: The Circular Poster the year in a circle; each day corresponds to a circle segment. The length of each segment corresponds to the total track distance of that day.
Area selection
When requesting a heatmap poster, you can set center (as latitude/longitude pair) and radius (in km) for the area RUNALYZE should look at. The center defaults to your last start coordinates and the radius is set to 200 km by default. You can simply drag and drop the marker to choose another location and use the input for radius to adjust the area’s size. All activities starting or ending in the resulting circle will be drawn in the heatmap. The area selection applies for the grid poster as well, the other poster types (circular, calendar) are not affected by these settings.
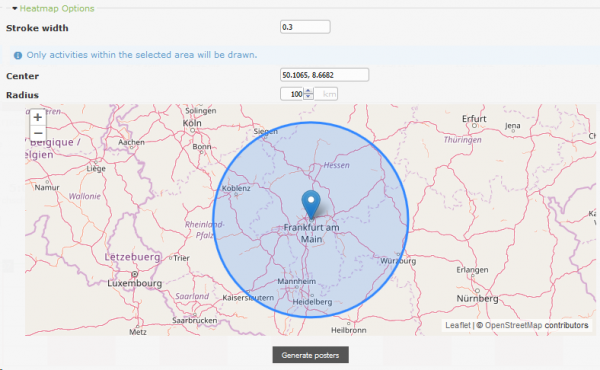
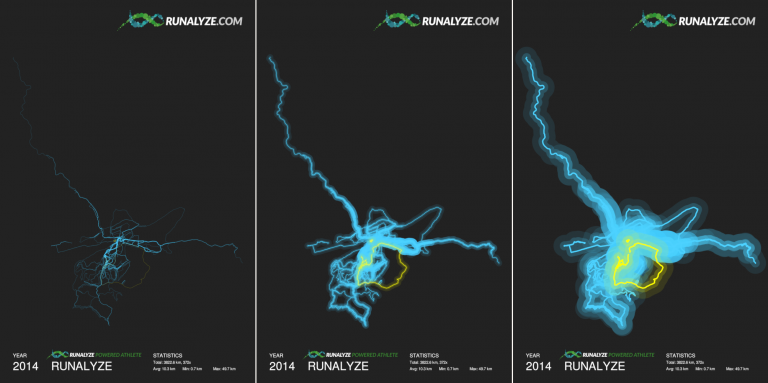
Furthermore, you can specify the stroke width for the heatmap. It depends on how many activities fall into your selected area and what you prefer. You can choose any stroke width between 0.01 and 1.0 (default: 0.3). The following shows three examples for different stroke widths:
Related articles
Didn't find an answer to your question?
Please let us know if you have wishes or have encountered bugs. We give our best to make Runalyze as good as possible for you. - Therefore we would be interested in your suggestions for improvement. In general most questions, problems and ideas are more appropriate to ask in the forum.
