Hulp en Ondersteuning » Features
Tool: Dynamic historams
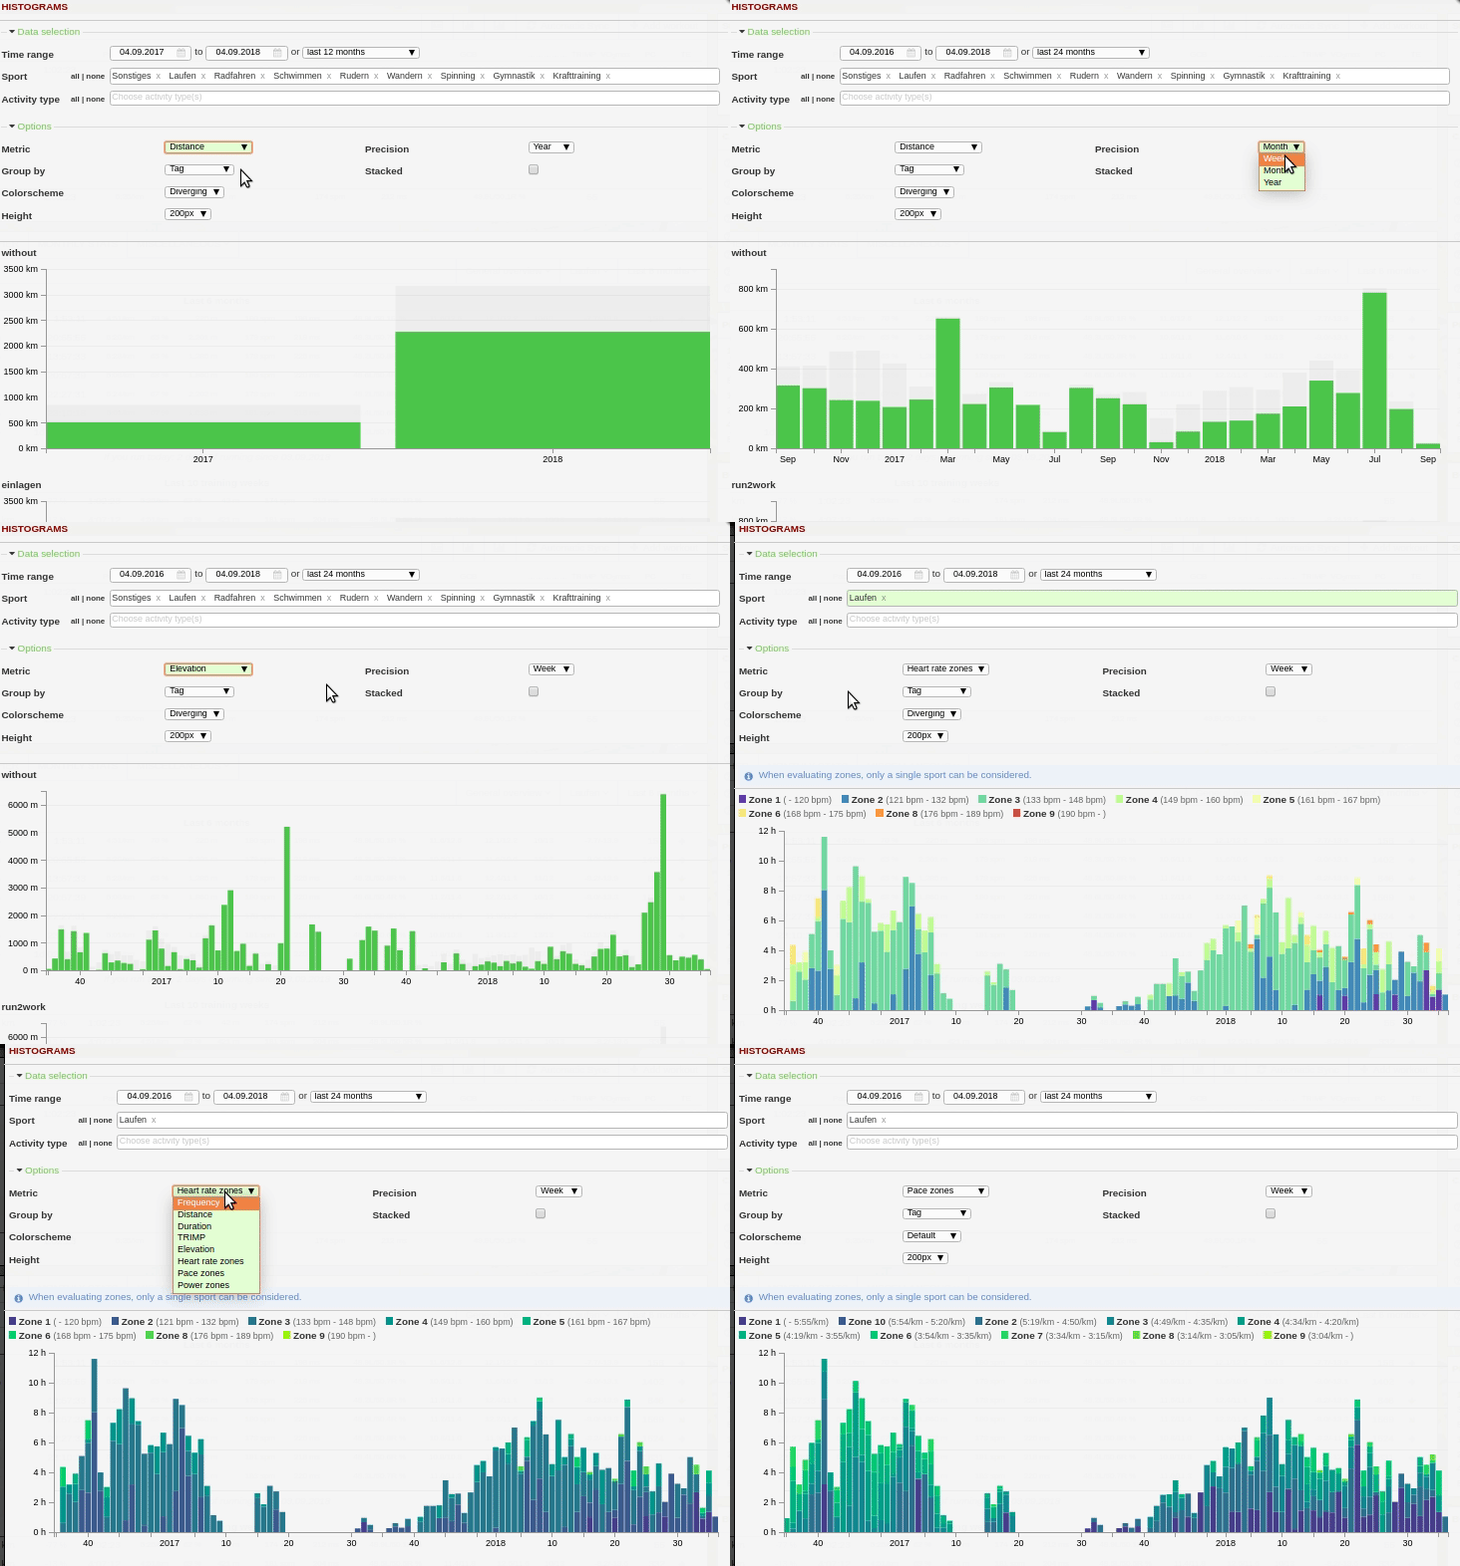
The dynamic histogram tool is very powerful and can be dynamically adjusted. The tool also allows evaluation by tags (which day was used how often or how much training workload was marked accordingly) and by zones* (heart rate, pace, power).
( As usual, only the average values per activity are currently taken into account)

- Arbitrary choice of time span
- Arbitrary choice of sports and training types
- Summary of data: weekly, monthly or yearly
- Individual charts (or stacked bars) depending on sport, training type or day
- Alternative sports can be grouped
- Evaluation according to: Distance, duration, number of trainings, trimp, altimeter or zones
- Height and color scheme of the plot can be changed
The following must be considered:
- An evaluation by zones is only possible for one sport, as the zones differ depending on the sport.
- When tags are analyzed, activities (especially in the stacked variant) can be countedm
Betreffende artikels
Vond je geen antwoord op je vraag?
Laat het ons weten als u wensen heeft of als u een bugs gevonden heeft. Wij doen ons best om Runalyze voor u zo goed mogelijk te maken. Daarom zijn we geïnteresseerd in uw suggesties voor verbetering. In het algemeen kunnen vragen, problemen en ideeën beter gesteld worden in het forum.

 Volg ons
